
Introduction:
OMD is the Open Monitoring Distribution which is used to monitoring of hosts and the services of the host which we are monitoring. Host includes all the networking devices, websites, server and etc.,
If we are managing a large number of infrastructure and services. We should be monitoring all the services manually. Instead of monitoring the hosts by manual process the monitoring software’s can help us to monitor the hosts for every hours or seconds as per our wise. In a scenario of monitoring, if anything goes down then monitoring system need to send the notification. In specific situation the notification will arise for the services such as increase in memory usage, abnormal amount of TCP connection.
There are lot of monitoring application available but this OMD is the best for monitoring the host and its services.
Open Monitoring Distribution (OMD) is a bundle software with lot of add-ons, it is Nagios based monitoring system, it will have addon such as Check_mk, Nagvis, Nagios, Thugs. It is mainly bundled with the Check_mk Multisite, we can run multiple site. The main feature of OMD supports the distributed monitoring. It gives us the web interface for easier administration and configuration, user-friendly dashboard, robust notification, and easier to install monitoring agent for any Linux and Windows machines.
Open Monitoring Distribution with Check_mk makes us easier to configure the monitoring configuration and the server can be monitored with the particular agents that help us to manage various host and services across the IT infra. In this text we will show how to install and configure necessary tools to monitor two Droplets. Here are your prerequisites:
- One Droplet with Ubuntu 14.04
- One Droplet with CentOS 7
- root access to your Droplets
Throughout the article we need only the basic knowledge’s of the CLI in Linux.
Installation & Configuration
It is a good practice to update the Linux repo to latest version before installing any tool.
apt-get update
apt-get upgrade
The OMD projects provides the ready to use packages to be installed in the Ubuntu machines.
The major confusion in difference between downloading the package from OMD site and Check_mk is undescribed in any of the web. OMD is a open source software, which is used by the official Check_mk to create a package that is more better than OMD. Check_mk Website have released a latest update in 2015 as 1.4.5p but OMD have old version. The latest version of Check_mk is available in raw and enterprise version is available, Check_mk is available for the free as raw edition. The latest version of Check_mk also have all the bundles in it such as Nagios, Nagvis, Thugs, and etc.,
Download Page: https://mathias-kettner.de/check_mk_download_version.php?HTML=yes&version=1.2.8p23&edition=cre
Choose according to the Linux distort, in this case we are using Ubuntu server.
To download the package, execute:
wget https://mathias-kettner.de/support/1.2.8p23/check-mk-raw-1.2.8p23_0.stretch_amd64.deb
Since the file is quite big, it may take some time to download. When the download completes you should see a message similar to the one below:
100%[=================================================================>] 78,969,558 24.6MB/s in 3.1s
2014-08-30 06:23:21 (24.6 MB/s) – “omd-1.20.trusty.amd64.deb” saved [78969558/78969558]
To install the newly downloaded package, type:
dpkg -i check-mk-raw-1.2.8p23_0.stretch_amd64.deb
This will fail on the first try, since the OMD package has multiple dependencies. That’s fine. After trying to install the package, we will see an error message:
root@omdmaster:~# dpkg -i check-mk-raw-1.2.8p23_0.stretch_amd64.deb
Selecting previously unselected package omd-1.20.
(Reading database … 86590 files and directories currently installed.)
Preparing to unpack omd-1.20.trusty.amd64.deb …
Unpacking omd-1.20 (0.trusty) …
dpkg: dependency problems prevent configuration of omd-1.20:
omd-1.20 depends on libsnmp-python; however:
Package libsnmp-python is not installed.
omd-1.20 depends on dialog; however:
Package dialog is not installed.
omd-1.20 depends on fping; however:
Package fping is not installed.
omd-1.20 depends on graphviz; however:
Package graphviz is not installed.
omd-1.20 depends on libapache2-mod-fcgid; however:
Package libapache2-mod-fcgid is not installed.
omd-1.20 depends on libapache2-mod-proxy-html; however:
Package libapache2-mod-proxy-html is not installed.
omd-1.20 depends on apache2-mpm-prefork; however:
Package apache2-mpm-prefork is not installed.
omd-1.20 depends on apache2-utils; however:
Package apache2-utils is not installed.
omd-1.20 depends on libboost-program-options1.54.0; however:
Package libboost-program-options1.54.0 is not installed.
omd-1.20 depends on libboost-system1.54.0; however:
Package libboost-system1.54.0 is not installed.
omd-1.20 depends on libdbi1; howeve
dpkg: error processing package omd-1.20 (–install):
dependency problems – leaving unconfigured
Processing triggers for ureadahead (0.100.0-16) …
Processing triggers for man-db (2.6.7.1-1) …
Errors were encountered while processing: omd-1.20
Default the error message will be display, after the command executed.To resolve missing dependencies, we must execute:
apt-get -f install
We will see that apt-get wants to install many new packages, including apache2 and mysql. This is expected, since OMD is using a web-accessible user interface and stores some of its data in a MySQL database.
Now the installation should complete successfully:
Reading package lists… Done
Building dependency tree
Reading state information… Done
Correcting dependencies… Done
The following extra packages will be installed:
apache2 apache2-bin apache2-data (…)
0 upgraded, 147 newly installed, 0 to remove and 3 not upgraded.
1 not fully installed or removed.
Need to get 53.9 MB of archives.
After this operation, 275 MB of additional disk space will be used.
Do you want to continue? [Y/n]
After agreeing to the installation of all dependencies (press y), we will be prompted to set up a root password for the MySQL database.
Don’t set the password for MySQL, just skip by typing Enter.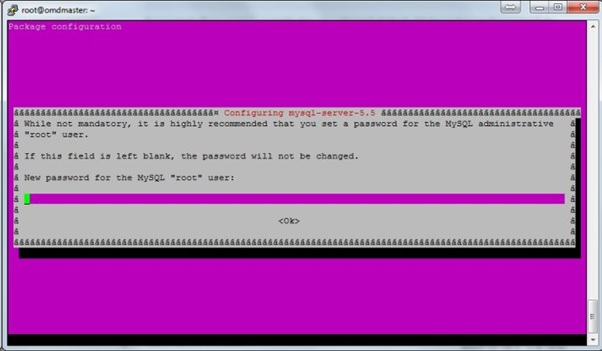
Now the OMD is installed, then proceed with command to get idea about OMD.
omd
Output:
Usage (called as root):
omd help Show general help
(…)
General Options:
-V <version> set specific version, useful in combination with update/create
omd COMMAND -h, –help show available options of COMMAND
You can maintain multiple sites using Check_mk, it can be also called as instances. You can create, start, stop, restart an instance or a site from OMD console.
Before creating a new instance, we need to choose a name to identify the instance.
To create the instance, type:
omd create monitoring
Now the command will run everything automatically,
Adding /omd/sites/monitoring/tmp to /etc/fstab.
Restarting Apache…AH00558: apache2: Could not reliably determine the server’s fully qualified domain name, using 127.0.1.1. Set the ‘ServerName’ directive globally to suppress this message
OK
Creating temporary filesystem /omd/sites/monitoring/tmp…OK
Created new site monitoring with version 1.20.
The site can be started with omd start monitoring.
The default web UI is available at http://omdmaster/monitoring/
The admin user for the web applications is cmkadmin with password kukhww2.
Please do a su – monitoring for administration of this site.
The password will be random for each instance or site you create.
Access the website: http://IPADDRESS/monitoring/
IP address you defined for the Ubuntu server.
The command will automatically create a new user and add to a particular group.
You can switch to particular user where the services are running. Then you can proceed with the administrative commands such as cmk. Then you can find lot of administrative option for the particular user. If your root user, then switch to the particular user through the command as below.
sudo su – monitoring
Now, the instance is created you can now proceed with the starting of the instance with the following commands.
omd start monitoring
All the necessary services will be started by the command automatically.
Starting rrdcached…OK
Starting npcd…OK
Starting nagios…OK
Starting dedicated Apache for site monitoring…OK
Initializing Crontab…OK
To access the OMD instance, please open http://ubuntuserversip/monitoring/ in the web browser. It will be prompted for a password. The default one is omdadmin for username and omd for password, change the default password later on.
Upon logging in we should see a web page like the one below:
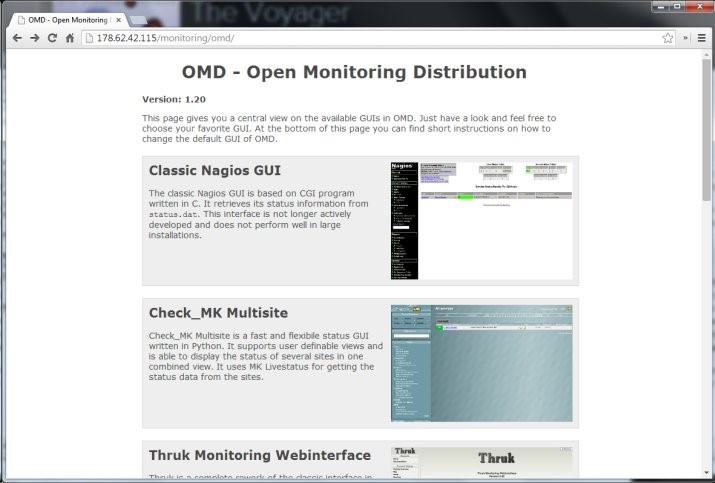
This is the default OMD page which give access to all the installed tools and application.
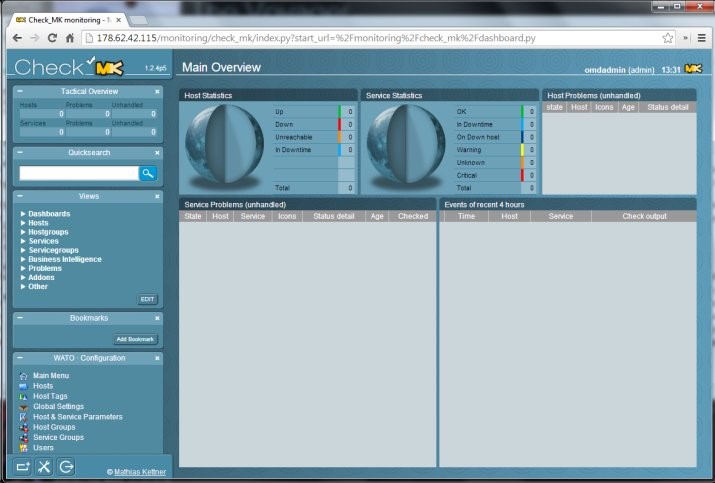
Check_mk screen opens with the dashboard of Check_mk by default, you can change this with the command.
omd config monitoring
The below screenshot shows the dashboard of the site.
Configuring Host in Check_MK:
To add a new host in the Check_mk, we need to direct to the hosts folder option in WATO Administration menu on the left, then click Create new host. Then you will be asked to fill some details about the host.
We can use hostname too, if the host is fully-qualified domain name then the IP address will be fetched easily from that DNS name by Monitoring system. According to experience from monitoring, it is recommended to give both host and IP address because it can be changed according our wise later.
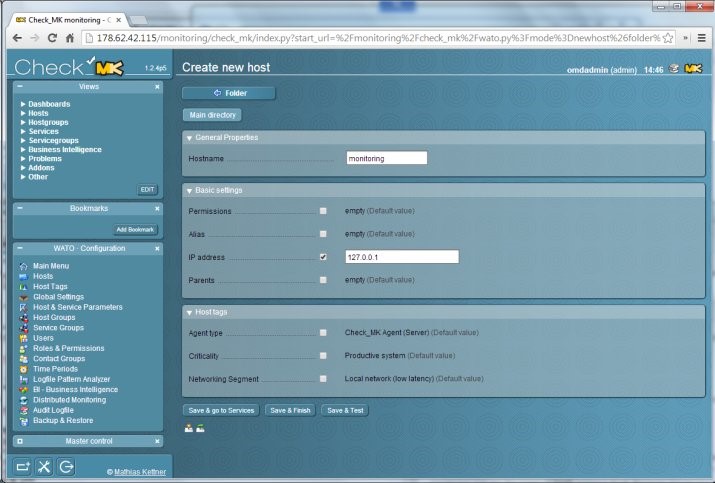
We can try monitoring the localhost, where the monitoring system is running. Just give IP Address 127.0.0.1. Check the box to enable the IP settings. Set the Check_mk agent as default agent for the configuration. In most of the cases we need to monitor the device using SNMP protocol which is the stored information in a device by default. Since it is a local host, the default setting is fine as well. Alias name is the another name for the host, if you set the parents. The networking segment setting is used to denote hosts on remote networks. If the hoist is in remote place use WAN latency, if it is local then set Local latency. Nothing but the RTT timing of the ping will be different. It will be high for WAN but for local it will be lesser.
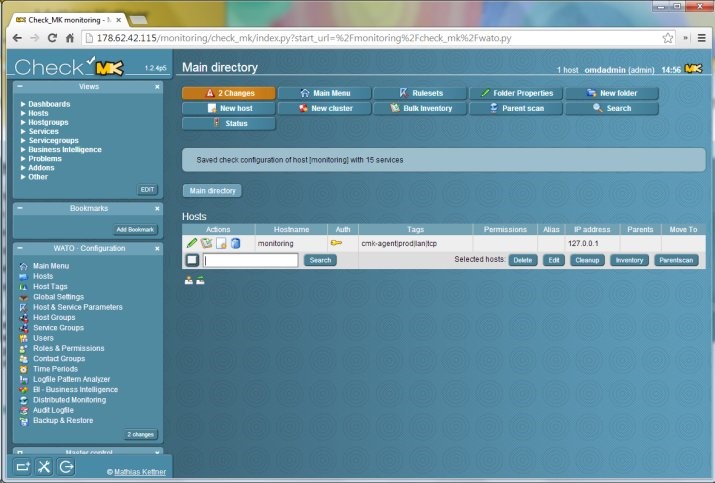
To save the host and configure which services will be monitored, click the Save & go to services button.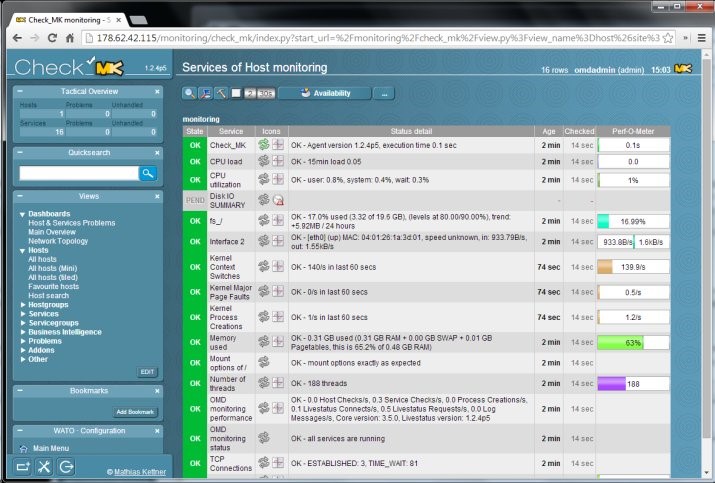
Check_MK will do an automatic inventory checking. That means it will gather the output from the agent shows us what kinds of services it can monitor. All available services for monitoring will be on the list, including CPU load, memory usage, and free space on disks. To save the available checks we have to click the Save manual check configuration button.
Everytime when we have changed anything in monitoring, we have to save the changes. The default check time for a hosts is 60 seconds.
Activated before they will be fully taken into account. We have to press the 2 Changes button and accept the changes.
Working with Monitoring Data:
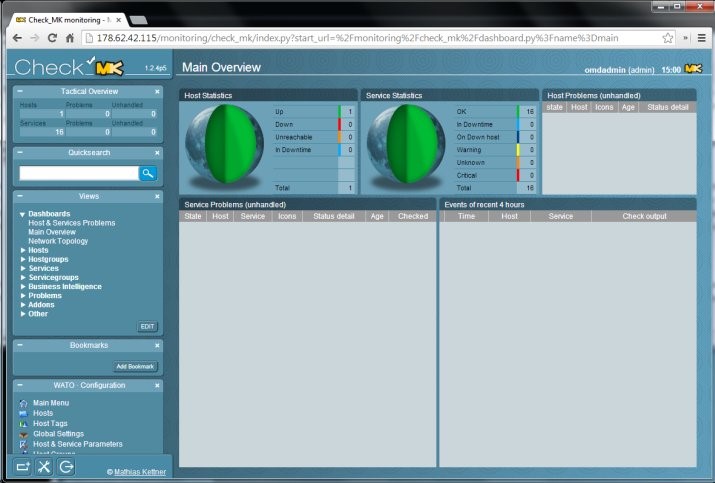
Now let’s take a look at the main dashboard using the Dashboards/Main Overview menu item on the left. The Earth sphere will now be fully green and the table will say that one host is up with no problems. We can see the full host list, now consisting of a single host, in the Hosts/All hosts view (using the menu on the left).
There we will see how many services are in good health (shown in green), how many are failing, and how many are yet pending to be checked. After clicking on the host name we will be able to see the list of all services with their full statuses and their Perf-O-Meters. Perf-O-Meter thus shows the performance of a single service relative to what Check_MK considers to be good health.
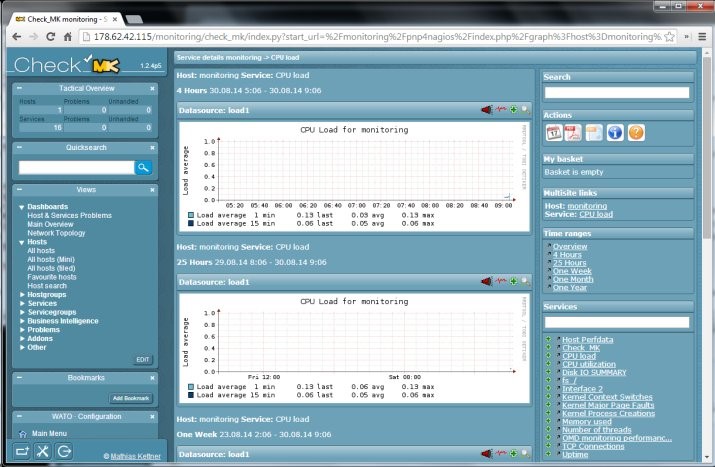
All services that return data that can be represented on a graph have a graph icon next to their name. We can use that icon to get access to graphs associated with the service. Since the host monitoring is fresh, there is almost nothing on the graphs – but after some time the graphs will provide valuable information on how the service performance changes over time.
All the changes up and down can be tracked using the graphs.
When any of the services fails or recovers, information will be shown on the dashboard. For failing services, a red error will be shown, and the problem will also be visible on the Earth graph.
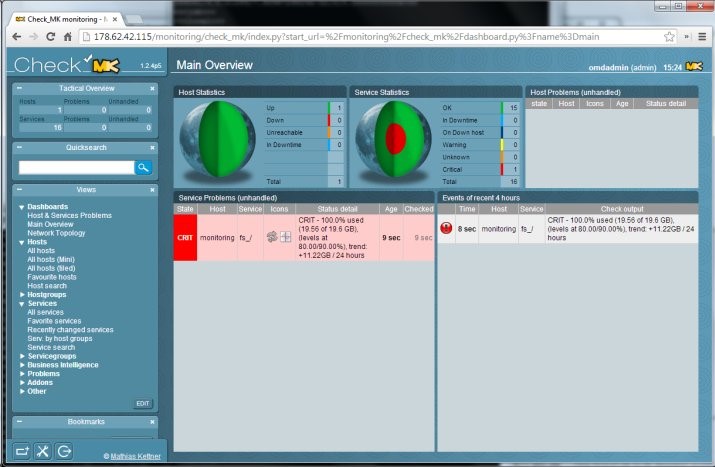
After recovery, everything will be shown in green as working properly, but the event log on the right will contain information about past failures.
In latest version of Check_mk 1.4.p5 have all agents in it, we can download them in WATO configuration.